《代碼分析工具》(JetBrains dotTrace Performance )v5.2.1100.84[壓縮包] 簡介: 中文名 : 代碼分析工具 英文名 : JetBrains dotTrace Performance 資源格式 : 壓縮包 版本 : v5.2.1100.84 發行時間 : 2012年 制作發行 : JetBrains 語言 : 英文 簡介 : 軟件類型:軟件>編程開發 軟件性質:破解軟件 操作系統:Windows 應用平台:Microsoft Window
電驢資源下載/磁力鏈接資源下載:
全選
"《代碼分析工具》(JetBrains dotTrace Performance )v5.2.1100.84[壓縮包]"介紹
中文名: 代碼分析工具
英文名: JetBrains dotTrace Performance
資源格式: 壓縮包
版本: v5.2.1100.84
發行時間: 2012年
制作發行: JetBrains
語言: 英文
簡介:

軟件類型:軟件>編程開發
軟件性質:破解軟件
操作系統:Windows
應用平台:Microsoft Windows XP SP3/Server 2003/Vista/Server 2008/Windows 7 (incl. 64-bit)
問題反饋:http://www.jetbrains.com/support/index.html
網站鏈接:http://www.jetbrains.com/profiler/
軟件介紹:
JetBrains公司出品的代碼分析工具,可從函數級\語句級別為編程人員以直觀清晰的方式分析程序運行過程中所占用的CPU時間,從而為優化代碼設計提供科學合理的建議.
JetBrains dotTrace Performance 是一個簡單而快速的NET應用程序的性能和內存分析器。dotTrace Performance 有助於NET開發人員迅速找到性能瓶頸,並選擇最佳的方式來優化他們的應用程序。
dotTrace Performance 有助於檢測多種.NET Framework應用程序的性能瓶頸。
System Requirements
Microsoft Windows XP, Vista, Windows 7, or 2003/2008 Server
Microsoft .NET Framework 3.5 SP1 (for remote profiling — on both local and remote machines)
512 MB of RAM or more is recommended
200 MB of hard drive space
dotTrace Performance helps detect performance bottlenecks
in a variety of .NET Framework applications.
Profile any .NET application: Profile the performance of applications targeting .NET Framework 1.0 to 4.5, Silverlight 4, or .NET Compact Framework 3.5.
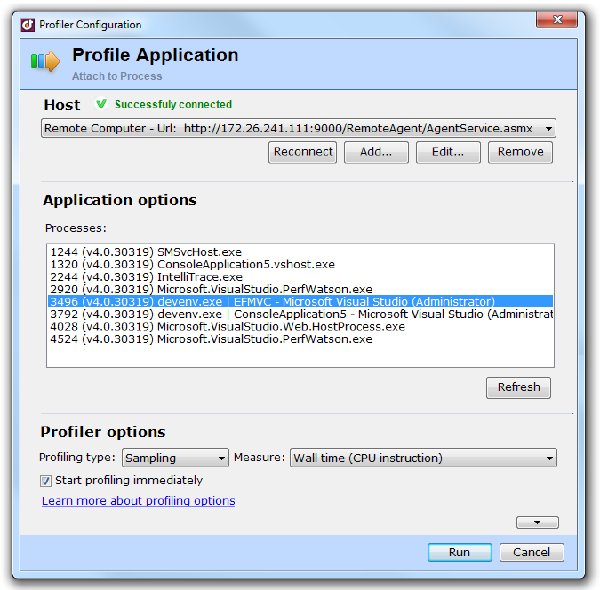
Profile anywhere: Profile applications on your local computer, or remotely with an automatic utility.
Multiple profiling modes: Choose sampling mode for fast profiling, tracing for high accuracy, and line-by-line profiling to analyze complex business logic.
Clear data representation: Choose between several views that streamline analysis of profiling data in snapshots.
Detect bottlenecks quickly: Take advantage of efficient navigation, easy filtering, smart search and handy source preview.
Use multiple tabs: Open a specific call or all calls of a suspect function in a separate tab to focus on its performance.
Annotate snapshots: Create textual annotations to selected functions to review them later on.
Estimate performance gains: Immediately estimate how removing a bottleneck would affect overall performance — without recalculating your snapshot.
Survive server-scale snapshots: Profile complex desktop and server applications. Process snapshots of up to several hundred GB in size.
Speed and accuracy: Enjoy the fastest and most accurate profiling in dotTrace history. Use the High Accuracy mode to account for the time spent inside the profiler.
Integration with Visual Studio and ReSharper: Profile applications right from within Visual Studio 2005, 2008, or 2010. Navigate from a function in a snapshot directly to its source file in Visual Studio. Profile unit tests quickly when working with ReSharper.
dotTrace Memory lets you discover memory leaks and optimize memory usage
in applications based on .NET Framework up to version 4.
Support for a variety of .NET applications: dotTrace 3.5 Memory helps you find memory leaks in applications based on .NET Framework 1.0 to 4.0, including desktop, web applications, and Windows services.
Two profiling modes: Identify instant memory status, or monitor memory allocation dynamics over time.
Convenient data representation: Depending on the task at hand, use different snapshot views, such as Class List, Namespace Tree, or Outgoing References.
Focus on important data: Open parts of a memory snapshot in separate tabs, use filters, folding and other options to focus on what's important for you.
Find objects by class: If you are looking to optimize a certain class, you can quickly find all objects of this class in a memory snapshot.
Preview source code: While analyzing a snapshot, you can instantly view the source code of any functions involved.
代碼
英文名: JetBrains dotTrace Performance
資源格式: 壓縮包
版本: v5.2.1100.84
發行時間: 2012年
制作發行: JetBrains
語言: 英文
簡介:
軟件類型:軟件>編程開發
軟件性質:破解軟件
操作系統:Windows
應用平台:Microsoft Windows XP SP3/Server 2003/Vista/Server 2008/Windows 7 (incl. 64-bit)
問題反饋:http://www.jetbrains.com/support/index.html
網站鏈接:http://www.jetbrains.com/profiler/
軟件介紹:
JetBrains公司出品的代碼分析工具,可從函數級\語句級別為編程人員以直觀清晰的方式分析程序運行過程中所占用的CPU時間,從而為優化代碼設計提供科學合理的建議.
JetBrains dotTrace Performance 是一個簡單而快速的NET應用程序的性能和內存分析器。dotTrace Performance 有助於NET開發人員迅速找到性能瓶頸,並選擇最佳的方式來優化他們的應用程序。
dotTrace Performance 有助於檢測多種.NET Framework應用程序的性能瓶頸。
System Requirements
Microsoft Windows XP, Vista, Windows 7, or 2003/2008 Server
Microsoft .NET Framework 3.5 SP1 (for remote profiling — on both local and remote machines)
512 MB of RAM or more is recommended
200 MB of hard drive space
dotTrace Performance helps detect performance bottlenecks
in a variety of .NET Framework applications.
Profile any .NET application: Profile the performance of applications targeting .NET Framework 1.0 to 4.5, Silverlight 4, or .NET Compact Framework 3.5.
Profile anywhere: Profile applications on your local computer, or remotely with an automatic utility.
Multiple profiling modes: Choose sampling mode for fast profiling, tracing for high accuracy, and line-by-line profiling to analyze complex business logic.
Clear data representation: Choose between several views that streamline analysis of profiling data in snapshots.
Detect bottlenecks quickly: Take advantage of efficient navigation, easy filtering, smart search and handy source preview.
Use multiple tabs: Open a specific call or all calls of a suspect function in a separate tab to focus on its performance.
Annotate snapshots: Create textual annotations to selected functions to review them later on.
Estimate performance gains: Immediately estimate how removing a bottleneck would affect overall performance — without recalculating your snapshot.
Survive server-scale snapshots: Profile complex desktop and server applications. Process snapshots of up to several hundred GB in size.
Speed and accuracy: Enjoy the fastest and most accurate profiling in dotTrace history. Use the High Accuracy mode to account for the time spent inside the profiler.
Integration with Visual Studio and ReSharper: Profile applications right from within Visual Studio 2005, 2008, or 2010. Navigate from a function in a snapshot directly to its source file in Visual Studio. Profile unit tests quickly when working with ReSharper.
dotTrace Memory lets you discover memory leaks and optimize memory usage
in applications based on .NET Framework up to version 4.
Support for a variety of .NET applications: dotTrace 3.5 Memory helps you find memory leaks in applications based on .NET Framework 1.0 to 4.0, including desktop, web applications, and Windows services.
Two profiling modes: Identify instant memory status, or monitor memory allocation dynamics over time.
Convenient data representation: Depending on the task at hand, use different snapshot views, such as Class List, Namespace Tree, or Outgoing References.
Focus on important data: Open parts of a memory snapshot in separate tabs, use filters, folding and other options to focus on what's important for you.
Find objects by class: If you are looking to optimize a certain class, you can quickly find all objects of this class in a memory snapshot.
Preview source code: While analyzing a snapshot, you can instantly view the source code of any functions involved.
代碼
. '
.:
` ::
: `:
' `.
/ \
.' `.
. -- . . . -- .
. `. _ _ .' .
`._ _.' \( . )/ `._ _.'
/ `_ . _' \
:: \ : / ::
:::: `. . . | . . . .' ::::
::: :::: ```` |\ _ __.i| S!._ /| '''' :::: :::
:::... | \__________. .__________/ | ...:::
:::::: | | | | ::::::
:: _. | | | | ._ ::
. _ __\| | _______.' `._______ | |/__ _ .
._________ |_ |____. . . .____| _| _________.
_| \| | | |/ |_
. \| " | | " |/ .
. _.i(\ \ ' | | ' / /)i._ .
"""______|\ ' ` . /|______"""
| "|_\ E M B R A C E . /_|" |
___| ____ _ _ ____________ i |___
' | | |/ "| | `
! ! ._____________ ' !
_____________ ______ _______________/ /________________ __________
_______// | _______ /_______ /_____ ______/ _______/
/ . |/ _| _/_ _/ _/ _ | /
_____/ /| " . \_ | \ ' | `.__ _____/
_______________/ |____/|_____| |____|\____________________//_____________
. ___ /_____________________| . . .
| \ / . ' | .___.' |
. ___|_ \/ |__________.| _ __| `S! _|___ .
|/ ._ `.______________. `. \|
/ |___ _ . \
/. : .\
/_|____________ .______..-' _|_\
|____________|____________ ____________|____________|
| | | |
|____________|___________|____________|
. |
|__________i|
. .
: |
| _i|
_ |_____..i|_||
`'-. "``-.!
` '
P r o u d l y . P r e s e n t s . .
. _
_________________________|( \.-.___________`-.___ _ ___________
| |
| JetBrains dotTrace Performance v5.2.1100.84 |
| (c) JetBrains |
| date : o3 Aug, 2o12 size : 06 disks/5.00 MB |
| os : WinAll x86/x64 language : English |
| type : Development |
| protection : RSA |
|_____________________________________________________________. |
______________________________________________________
: | .' :
._ | |__________________________________________________. | _.
|/ | | \|
\ | | /
\ | dotTrace is a family of performance and memory profilers | /
\| for .NET applications. |/
` '
. Our latest release, dotTrace 5.0 Performance, helps .NET .
: developers quickly find performance bottlenecks and :
| optimize their applications. |
| |
| * Take it easy |
| dotTrace Performance helps detect performance bottlenecks |
| in a variety of .NET Framework applications. |
| |
| * Profile any .NET application: Profile the performance of |
| applications targeting .NET Framework 1.0 to 4.0, |
| Silverlight 4, or .NET Compact Framework 3.5. |
| |
| * Profile anywhere: Profile applications on your local |
| computer, or remotely with an automatic utility. |
| |
| * Multiple profiling modes: Choose sampling mode for fast |
| profiling, tracing for high accuracy, and line-by-line |
| profiling to analyze complex business logic. |
| |
| * Clear data representation: Choose between several views |
| that streamline analysis of profiling data in snapshots. |
| |
| * Detect bottlenecks quickly: Take advantage of efficient |
| navigation, easy filtering, smart search and handy source |
| preview. |
| |
| * Use multiple tabs: Open a specific call or all calls of a |
| suspect function in a separate tab to focus on its |
| performance. |
| |
| * Annotate snapshots: Create textual annotations to |
| selected functions to review them later on. |
| |
| * Estimate performance gains: Immediately estimate how |
| removing a bottleneck would affect overall performance - |
| without recalculating your snapshot. |
| |
| * Survive server-scale snapshots: Profile complex desktop |
| and server applications. Process snapshots of up to several |
| hundred GB in size. |
| |
| * Speed and accuracy: Enjoy the fastest and most accurate |
| profiling in dotTrace history. Use the High Accuracy mode |
| to account for the time spent inside the profiler. |
| |
| * Integration with Visual Studio and ReSharper: Profile |
| applications right from within Visual Studio 2005, 2008, or |
| 2010. Navigate from a function in a snapshot directly to |
| its source file in Visual Studio. Profile unit tests |
| quickly when working with ReSharper. |
| |
| URL: http://www.jetbrains.com/profiler |
| |
| INSTALL NOTES: |
| |
| Use the included keymaker to register ... |
| __|__ __
|_ E n j o y . . . /\ \\ `
|_|_____________________________________________________ __/ \____\\
)/\ \ / /
:::::::::::::::: [ g r o u p . i n f o ] ::::::::::: " \_\/____/
_ ____________________________________________________ _ / /\
|_| /____/ \
| It is 2012, and we are still here, over 10 years old. `" \ /
| We strive to bring you quality above all else, and .____\/
| hope to inspire other groups to do the same. |
| |
| Let us set an example, and motivate future generations |
| to learn reverse engineering, and join the scene. |
__ __|__ |
' // /\ We hope that, with your help, we can continue to |
//____/ \__ tackle every protection. |
\ \ / / |
\____\/_/ Contact information: [email protected] |
/\ \ . |
/ \____\ E M B R A C E .:: |
\ / "' established in October 2000 . .: .:::: |
\/____. _ _______________________ ______________________________|
__/ /_
[ g r e e |_ __/ i n g s ]
i.___________________________/ /_______________________________.i
| |
| |
| SSG TMG ECLiPSE ZWT AGAiN SHOCK LND CAFE DAMN TNO BAT |
: ACME ADDICTION NULL DI AiR :
. .
. ... and to all our old members: may you one day find .
' | your way back to us! ... | `
i | | i
__| |_ From the sky we will rise and conquer like we did so _| |___
/\ __ many times before, we will show the spirit of .. __ /\
/ \__/\ ....... /\__/ \
\ / \ `:::' .. / \ /
\/_ \ :::::: ::. ` .:: :::::: `: .:: :::. / _\/
/ \___ _ : ...: : `:' : : ...:. : .::' _ ___/ \
\ / :..... : :. .: : :.....: : :::: \ /
\ / `:' \ /
\ / :. .: E M B R A C E ! \ /
\/__ _ `:' _ __\/
相關資源:


- [行業軟件]《家居設計繪圖軟件》(Chief Architect Picture Painter )英文[Bin]
- [系統工具]《系統檢查》(System Spec)2.77[壓縮包]
- [多媒體類]《數碼照片管理和處理軟件》(Corel AfterShot Pro) v1.0.1.10 [壓縮包]
- [操作系統]《Microsoft Windows Server 2003 Service Pack 1 Final》(Microsoft Windows Server 2003 Service Pack 1 Final),操作系統、資源下載
- [行業軟件]《渲染終極者 finalRender R3.5 SE SP1 for 3dsmax 2009/2010/2011 32/64位 頂渲簡體中文版》[壓縮包]
- [應用軟件]《報告快速創建/設計工具軟件》(NextReports Designer)v2.4破解版[壓縮包]
- [行業軟件]《VERITAS網絡備份企業版v6.0》(VERITAS.NetBackup.Enterprise.v6.0)(帶keygen,客戶端和中文手冊)[ISO],行業軟件、資源下載
- [編程開發]《文件菜單修改器》(eXeScope v6.5)免費版[壓縮包]
- [應用軟件]《地圖圖形繪制處理工具》(Global Mapper)V 12.00 x86/x64[壓縮包]
- [行業軟件]《約會記錄和日程管理工具》(Soft-Evolution Pimero Pro 2012 R1 )v7.1.4437[壓縮包]
- [應用軟件]《業務流程服務器》(IBM WebSphere Process Server 6.01)[Bin],應用軟件、資源下載
- [教育綜合]《余世維 講座之“贏在執行” MP3 音頻版》(Win in Excution)MP3 音頻版[MP3]
- [經濟管理]《創業寶典 未來企業家之路 第5版》掃描版[PDF]
- [生活百科]《雞尾酒調制技法》(陳浩)文字版[PDF] 自來下載
- [人文社科]典型辦公文檔大全
- [硬盤游戲]《地球帝國2:霸權的藝術》(Empire Earth 2 - The Art of Supremacy)簡體中文硬盤版[壓縮包]
- [教育綜合]《09萬國重點學科班課程講座(5月20日更新09大綱新舊對比)》[壓縮包]
- [文學圖書]《黃裳散文選集》(黃裳)掃描版[PDF]
- [其他資源綜合]《形意拳真傳圖譜》掃描版[PDF] 資料下載
- [文學圖書]《何其芳散文選集》掃描版[PDF]
- 系統架構師軟考
- 《PHP編輯器》(Embarcadero RadPHP XE2)v4.0.0.1547[光盤鏡像]
- 《AspxGrid 2.0.6》(ASPxGrid and Editors Library v2.0.6 Final),編程開發、資源下載
- 《3D游戲開發工具和游戲引擎套件》(Unity3D)2.6.1破解版[壓縮包]
- 《CVS 用戶端》(SmartCVS Enterprise)v7.1.3[壓縮包]
- 《C語言速成3.0視頻教程》V3.0[ISO]
- 《NetAdvantage_20063_CLR2x》(NetAdvantage_20063_CLR2x)2006 Vol3 For .Net 2.0,編程開發、資源下載
- 《交互創建數字城市》(Procedural CityEngine)v2010 3.0125R Win32|64[壓縮包]
- 《Mapinfo Mapx開發資料》,編程開發、資源下載
- 《學生學編程》(scratch for veket)1.4.01[安裝包]
- 《Summitsoft 2000 Fonts Multi2 字庫》(Summitsoft 2000 Fonts)v4.2.0.0
- 大牛一步一步教你做網站(零基礎)DZ棒棒團
免責聲明:本網站內容收集於互聯網,本站不承擔任何由於內容的合法性及健康性所引起的爭議和法律責任。如果侵犯了你的權益,請通知我們,我們會及時刪除相關內容,謝謝合作! 聯系信箱:[email protected]
Copyright © 電驢下載基地 All Rights Reserved