《財務管理軟件》(jGnash for veket)2.5.1中文版[安裝包] 簡介: 中文名 : 財務管理軟件 英文名 : jGnash for veket 資源格式 : 安裝包 版本 : 2.5.1中文版 發行時間 : 2010年 地區 : 大陸,香港,台灣,美國,日本 語言 : 簡體中文,繁體中文,英文 簡介 : java軟件,依賴如下: 電驢資源 下面是用戶共享的文件列表,安裝電驢後,您可以點擊這些文件名進行下載 java-1.6.18-veket.p
電驢資源下載/磁力鏈接資源下載:
- 下載位址: [www.ed2k.online]jGnash-2.5.1-veket.pet
- 下載位址: [www.ed2k.online]budget4all-1.51-veket.pet
- 下載位址: [www.ed2k.online]java-1.6.20-veket.pet
- 下載位址: [www.ed2k.online]jGnash-2.3.4-veket.pet
- 下載位址: [www.ed2k.online]java-1.6.18-veket.pet
全選
"《財務管理軟件》(jGnash for veket)2.5.1中文版[安裝包]"介紹
中文名: 財務管理軟件
英文名: jGnash for veket
資源格式: 安裝包
版本: 2.5.1中文版
發行時間: 2010年
地區: 大陸,香港,台灣,美國,日本
語言: 簡體中文,繁體中文,英文
簡介:
java軟件,依賴如下:
電驢資源
下面是用戶共享的文件列表,安裝電驢後,您可以點擊這些文件名進行下載
java-1.6.18-veket.pet 詳情
35.7MB
全選
35.7MB
軟件類型:理財軟件
操作系統:veket
應用平台:veket全系列
網站鏈接:http://sourceforge.net/apps/mediawiki/jgnash
jGnash是一個免費版本的財務管理軟件,可以對個人財務狀況進行全面管理。它采用Java編寫,支持帳號管理,可以進行投資獲益分析,能夠提供財務狀況報告。
來吧轉發內容:
jGnash is a free (no strings attached!) personal finance manager with many of the same features as commercially-available software. It was created in order to make tracking your personal finances easy, but also provides the functionality required by advanced users. jGnash is cross-platform and will run on any operating system that has a working Java 1.6.0 Runtime Environment
Budget4All
電驢資源
下面是用戶共享的文件列表,安裝電驢後,您可以點擊這些文件名進行下載
budget4all-1.51-veket.pet 詳情
2.2MB
全選
2.2MB
java軟件,依賴如下:
電驢資源
下面是用戶共享的文件列表,安裝電驢後,您可以點擊這些文件名進行下載
java-1.6.18-veket.pet 詳情
35.7MB
全選
35.7MB

What it's all About...
It is all about BUDGET FORECASTING : the key principle adopted by Budget4All is to take into consideration the FUTURE incomes/expenses expected. Consequently, this is not the right tool if you want to enter your past bills, to print checks, to know how your money has been spent for the past year, etc. The data displayed always starts with tomorrow's cash balance.
The Concept of “Scenario”
Data is organized around the simple concept of a "scenario", which is essentially a file containing a set of incomes and expenses that you specify according to your own needs. You may define as many scenarios as you want (there are just files anywhere on your computer).
Each income or expense you define has several properties attached, such as the actual amount, the frequency, the starting and ending date, the annual growth if any, etc. You just set the values you want ! When Budget4All loads a scenario, it automatically runs a simulation using the data it contained and display the result in the main window as red curve that represents the evolution of the cash balance for the next 50 years. The first day covered by the simulation is actually the day after today.
It is possible to specify an annual inflation rate for a scenario. It can be a simple constant number (e.g. 4%) or a complex table of values (you specify the rate for each year). The inflation is applied to every income/expense of the scenario on the first of January of every year, unless you have specifically indicated that inflation does not affect the income/expense when you created the definition (see the “add effect of inflation on top of annual growth” checkbox)
You can export all the scenario data to a web browser or a CSV file (so you are not locked in Budget4All !).
You can also encrypt the content of your scenario file and password protect it, if you want the information to be kept strictly confidential.
Displaying your data
The starting amount of cash you have as of “today” ("today's balance") can be specified in a text box at the bottom of the screen. This is usually the first thing you do when opening a scenario, since Budget4All has no means to know this information.
You can change easily the duration of the time period displayed on screen using the “time interval” combo box (e.g. 6 months, 1 year, 2 years, etc).
You can also easily move to the next or previous period (e.g. the next 3 months) using the “left and right arrow” buttons in the lower right part ot the main window.
See the Keyboard Shorcuts item in the Help menu to perform these operations in a fast and convenient way.
If you click with the mouse inside the curve area, a crosshair appears at the nearest data point on the curve. The data point identify a set of incomes and/or expenses that occur on a particular day. Usefull detailled information about the data point selected appears on the right part of the screen.
Editing your data
The “Scenario -> Edit” menu allows you to painlessly edit the full content of the scenario, that is :
# adding / modyfing / deleting incomes or expenses.
# setting scenario information, like the title, a long description, the annual inflation rate, the currency used (hundreds are supported)
The table of incomes / expenses can be sorted by any of the column shown, in incresing or decreasing order : just click on the column header of the appropriate column to do so.
You can enable or disable any income / expense defined. This is very useful to test the effect of different incomes and expenses for the evolution of the cash balance. The disabled items are NOT taken into account by the analysis performed in the “Tools->Analysis” fonction.
For every income / expense shown, there is a very useful “impact per day” number displayed that calculates the daily equivalent ! That allows you to quickly check what are the items that have the most impact in the scenario !
When the edition of the scenario data is completed, it is essential that you click on the “Apply” button for the changes to be committed and the cash balance curve to be updated. Note that the changes are NOT saved to disk in the scenario file ! You must explicitely use the “Scenario-> Save” or “Scenario -> Save As” menu to do so !
Analysing your data
The “Tools -> Analysis” menu displays a window that shows the results of 4 real-time analysis conducted on the current data of the scenario :
# “Cashflow by weight” displays a pie chart that compares on a relative basis all the incomes / expenses for a given period (by default, the same that the one used for the curve on the main window). You can easily change the period with the spinners provided.
# “Financial Events” provides a detailed list of all financial events (occurence of an income or an expense) that occur for a given period. For each of them, the number of occurence and the total amount is provided. You can easily change the period with the spinners provided.
# “Monthly Stats” is a report that provides a monthly total of all incomes and expenses that occur during a given month and the associated total.
# “Yearly Stats” is a report that provides a yearly total of all incomes and expenses that occur during a given year and the associated total. Please note that this is NOT a calendar year, but a 1-year period starting from the next month.
[安裝測試]
★已經過安裝測試,測試系統為veket-2.39和lucky8k-veket-3.5。
殺毒提示:
已通過安全檢測.
安全檢測軟件:avast antivirus1.30
英文名: jGnash for veket
資源格式: 安裝包
版本: 2.5.1中文版
發行時間: 2010年
地區: 大陸,香港,台灣,美國,日本
語言: 簡體中文,繁體中文,英文
簡介:
java軟件,依賴如下:
電驢資源
下面是用戶共享的文件列表,安裝電驢後,您可以點擊這些文件名進行下載
java-1.6.18-veket.pet 詳情
35.7MB
全選
35.7MB
軟件類型:理財軟件
操作系統:veket
應用平台:veket全系列
網站鏈接:http://sourceforge.net/apps/mediawiki/jgnash
jGnash是一個免費版本的財務管理軟件,可以對個人財務狀況進行全面管理。它采用Java編寫,支持帳號管理,可以進行投資獲益分析,能夠提供財務狀況報告。
jgnash用了幾個月,感覺很好,我們用它記錄下了生活中每一筆開支。
jgnash對中文的支持很好,連界面也有中文化可以選擇。
當你第一次使用jGnash的時候,你可能會對一開始的空白屏幕感到吃驚。但是如果你有足夠耐心的話,你能夠發現,這款軟件有很多有意思的功能。如果你夠Geek你還可以自己寫Java腳本在jGnash裡運行。
來吧轉發內容:
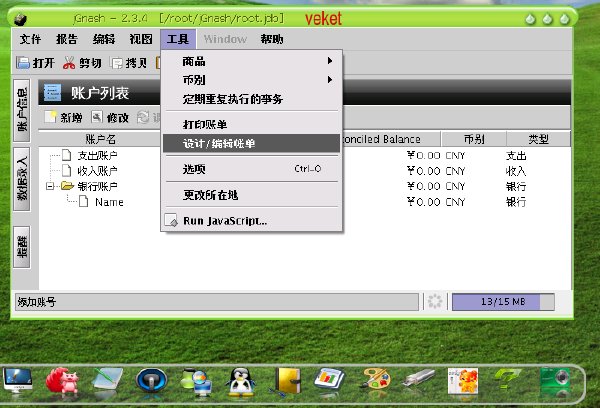
jGnash 的數據保存在 xml 文件中。
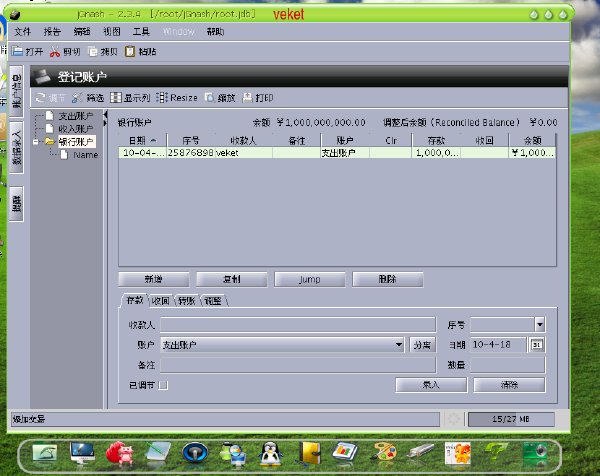
啟動後,首先要創建帳戶,帳戶主要分為三類:
1.支出
2.收入
3.銀行/現金
帳戶是一個樹結構,以層次,父子的形式組織帳戶的關系,右邊顯示的是最新余額。
帳戶創建後,就可以開始記帳了。
首先,給各個銀行卡,現金帳戶初始化余額,再陸續添加支出,收入記錄。
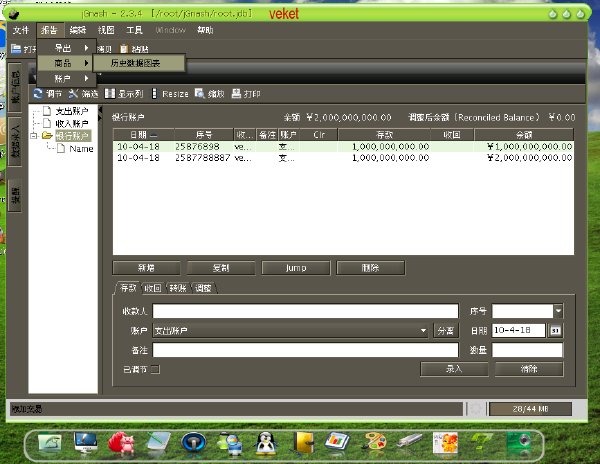
jGnash 提供了支出/收入餅圖,對各時間段內的情況進行統計。進入餅圖,選擇菜單相應項.
餅圖的中各帳戶,如果有下級帳戶存在,則還可以繼續深入,只要點擊相應帳戶區域,就會進入到該帳戶的下級帳戶收支餅圖中。
jGnash is a free (no strings attached!) personal finance manager with many of the same features as commercially-available software. It was created in order to make tracking your personal finances easy, but also provides the functionality required by advanced users. jGnash is cross-platform and will run on any operating system that has a working Java 1.6.0 Runtime Environment
Budget4All
電驢資源
下面是用戶共享的文件列表,安裝電驢後,您可以點擊這些文件名進行下載
budget4all-1.51-veket.pet 詳情
2.2MB
全選
2.2MB
java軟件,依賴如下:
電驢資源
下面是用戶共享的文件列表,安裝電驢後,您可以點擊這些文件名進行下載
java-1.6.18-veket.pet 詳情
35.7MB
全選
35.7MB
What it's all About...
It is all about BUDGET FORECASTING : the key principle adopted by Budget4All is to take into consideration the FUTURE incomes/expenses expected. Consequently, this is not the right tool if you want to enter your past bills, to print checks, to know how your money has been spent for the past year, etc. The data displayed always starts with tomorrow's cash balance.
The Concept of “Scenario”
Data is organized around the simple concept of a "scenario", which is essentially a file containing a set of incomes and expenses that you specify according to your own needs. You may define as many scenarios as you want (there are just files anywhere on your computer).
Each income or expense you define has several properties attached, such as the actual amount, the frequency, the starting and ending date, the annual growth if any, etc. You just set the values you want ! When Budget4All loads a scenario, it automatically runs a simulation using the data it contained and display the result in the main window as red curve that represents the evolution of the cash balance for the next 50 years. The first day covered by the simulation is actually the day after today.
It is possible to specify an annual inflation rate for a scenario. It can be a simple constant number (e.g. 4%) or a complex table of values (you specify the rate for each year). The inflation is applied to every income/expense of the scenario on the first of January of every year, unless you have specifically indicated that inflation does not affect the income/expense when you created the definition (see the “add effect of inflation on top of annual growth” checkbox)
You can export all the scenario data to a web browser or a CSV file (so you are not locked in Budget4All !).
You can also encrypt the content of your scenario file and password protect it, if you want the information to be kept strictly confidential.
Displaying your data
The starting amount of cash you have as of “today” ("today's balance") can be specified in a text box at the bottom of the screen. This is usually the first thing you do when opening a scenario, since Budget4All has no means to know this information.
You can change easily the duration of the time period displayed on screen using the “time interval” combo box (e.g. 6 months, 1 year, 2 years, etc).
You can also easily move to the next or previous period (e.g. the next 3 months) using the “left and right arrow” buttons in the lower right part ot the main window.
See the Keyboard Shorcuts item in the Help menu to perform these operations in a fast and convenient way.
If you click with the mouse inside the curve area, a crosshair appears at the nearest data point on the curve. The data point identify a set of incomes and/or expenses that occur on a particular day. Usefull detailled information about the data point selected appears on the right part of the screen.
Editing your data
The “Scenario -> Edit” menu allows you to painlessly edit the full content of the scenario, that is :
# adding / modyfing / deleting incomes or expenses.
# setting scenario information, like the title, a long description, the annual inflation rate, the currency used (hundreds are supported)
The table of incomes / expenses can be sorted by any of the column shown, in incresing or decreasing order : just click on the column header of the appropriate column to do so.
You can enable or disable any income / expense defined. This is very useful to test the effect of different incomes and expenses for the evolution of the cash balance. The disabled items are NOT taken into account by the analysis performed in the “Tools->Analysis” fonction.
For every income / expense shown, there is a very useful “impact per day” number displayed that calculates the daily equivalent ! That allows you to quickly check what are the items that have the most impact in the scenario !
When the edition of the scenario data is completed, it is essential that you click on the “Apply” button for the changes to be committed and the cash balance curve to be updated. Note that the changes are NOT saved to disk in the scenario file ! You must explicitely use the “Scenario-> Save” or “Scenario -> Save As” menu to do so !
Analysing your data
The “Tools -> Analysis” menu displays a window that shows the results of 4 real-time analysis conducted on the current data of the scenario :
# “Cashflow by weight” displays a pie chart that compares on a relative basis all the incomes / expenses for a given period (by default, the same that the one used for the curve on the main window). You can easily change the period with the spinners provided.
# “Financial Events” provides a detailed list of all financial events (occurence of an income or an expense) that occur for a given period. For each of them, the number of occurence and the total amount is provided. You can easily change the period with the spinners provided.
# “Monthly Stats” is a report that provides a monthly total of all incomes and expenses that occur during a given month and the associated total.
# “Yearly Stats” is a report that provides a yearly total of all incomes and expenses that occur during a given year and the associated total. Please note that this is NOT a calendar year, but a 1-year period starting from the next month.
[安裝測試]
★已經過安裝測試,測試系統為veket-2.39和lucky8k-veket-3.5。
殺毒提示:
已通過安全檢測.
安全檢測軟件:avast antivirus1.30
- 上一頁:《可視化模具設計軟件》(Camnetics GearTeq)v2010.18.64.317/含注冊機/x86+x64/更新rev18.32.318[壓縮包]
- 下一頁:《專業DJ混音軟件》(UltraMixer for veket)2.40專業版[安裝包]
相關資源:


- [應用軟件]《產品開發》(ThinkDesign)2006.1[Bin]
- [多媒體類]《TrackTeam Audio出品效果器套裝》(TrackTeam Audio PACK LiVE)[壓縮包]
- [應用軟件]《Photoshop CS2V9.0》簡體中文綠色版[壓縮包]
- [軟件綜合]【midas】土木工程一站式解決方案。。。。課設有需要,拿去。。。
- [行業軟件]《 達索 DELMIA_V5-6R2012_GA_Win64》(DELMIA_V5-6R2012_GA_Win64)[光盤鏡像]
- [網絡軟件]免費的監控電腦軟件(截屏、管理游戲、管理電腦時間等)
- [多媒體類]《集成多媒體播放器》(Cowon JetAudio)更新v8.0.16.2000.Plus.VX[壓縮包]
- [多媒體類]《索尼 影像編輯 專業版9.0e 32bit/64bit》(Sony Vegas Pro 9.0e 32bit/64bit)9.0e[安裝包]
- [應用軟件]《<<瑞星殺毒軟件+防火牆>>帶升級序列號》更新為:18.05.41版本[ISO],應用軟件、資源下載
- [行業軟件]《電力電子系統模擬工具》(Plexim PLECS Standalone)v3.1.5 for Windows x86|x64[壓縮包]
- [經濟管理]《升職了,下一步我該做什麼》掃描版[PDF]
- [人文社科]《365天日語口語大全-日常口語篇》隨書光盤全部內容/無文本[壓縮包]
- [行業軟件]應求!CAD2007
- [應用軟件]《nokia6708行貨隨機光盤》[ISO],應用軟件、資源下載
- [人文社科]《地球之難:困境與選擇》掃描版[PDF]
- [英語學習資料]《中學生學好英語的奧秘 李陽》APE原版CD抓軌[APE]
- [教育綜合]《1985NCE3竹影無風英音128kbps版》[國外名曲背景音樂]
- [游戲周邊]《爭分奪秒 GT評測》(Split Second GT)[WMV]
- [其他圖書]《李氏形意太極拳》掃描版[PDF]
- [硬盤游戲]《兔子必須死》(Bunny Must Die)3DM軒轅漢化組簡體中文漢化免安裝完整硬盤版[壓縮包]
- 《曲面魔術師》(ICEM Surf)v4.8.0[光盤鏡像]
- 《專業廚房設計CAD》(Compusoft Winner v7.5a),行業軟件、資源下載
- 《加工及雕塑軟件》(DP.TECHNOLOGY.ESPRIT.V2006-MAGNiTUDE)[Bin]
- 《金蝶KIS》V7.5
- 《PTC- CAD/CAM/CAE集成軟件》(PTC PRO ENGINEER WILDFIRE V4 M080 Win32 DVD)[光盤鏡像]
- 《計算流體力學軟件》(cfdrc v2004)[Bin]
- 《HyperMILL 9.0》[Bin]
- 《type3.0三維雕刻軟件浮雕》內有破解補丁,行業軟件、資源下載
- 《太陽能光伏系統設計軟件》(PVsyst) v5.11[安裝包]
- 《流體動力學分析》(CD-adapco tar CD v4.08 x86 )[光盤鏡像]
- 《ERP管理軟件》(Sage Peachtree Quantum 2009)[ISO]
- 《Think3 ThinkDesign v2008.1.build.107.78 超現代造型設計軟件》(Think3 ThinkDesign v2008.1.build.107.78)多國語言版[光盤鏡像]
免責聲明:本網站內容收集於互聯網,本站不承擔任何由於內容的合法性及健康性所引起的爭議和法律責任。如果侵犯了你的權益,請通知我們,我們會及時刪除相關內容,謝謝合作! 聯系信箱:[email protected]
Copyright © 電驢下載基地 All Rights Reserved