《Java剖析工具》(EJ-Technologies JProfiler)v6.1.3 x86/x64[壓縮包] 簡介: 中文名 : Java剖析工具 英文名 : EJ-Technologies JProfiler 資源格式 : 壓縮包 版本 : v6.1.3 x86/x64 發行時間 : 2011年 制作發行 : ej-technologies GmbH 地區 : 德國 語言 : 英文 簡介 : JProfiler是一個全功能的Java剖析工具(profiler),專用於分析J2SE和
電驢資源下載/磁力鏈接資源下載:
- 下載位址: [www.ed2k.online][Java剖析工具].EJ.Technologies.JProfiler.v6.1.3.Incl.Keygen-FALLEN.zip
- 下載位址: [www.ed2k.online][Java剖析工具].EJ.Technologies.JProfiler.v6.1.3.x64.Incl.Keygen-FALLEN.zip
全選
"《Java剖析工具》(EJ-Technologies JProfiler)v6.1.3 x86/x64[壓縮包]"介紹
中文名: Java剖析工具
英文名: EJ-Technologies JProfiler
資源格式: 壓縮包
版本: v6.1.3 x86/x64
發行時間: 2011年
制作發行: ej-technologies GmbH
地區: 德國
語言: 英文
簡介:

JProfiler是一個全功能的Java剖析工具(profiler),專用於分析J2SE和J2EE應用程序。它把對CPU、執行線程和內存的剖析組合在一個強大的應用中。JProfiler的GUI可以讓你方便的找到效能瓶頸、內存洩漏(memory leaks)、並解決執行線程的問題。
JProfiler is an award-winning all-in-one Java profiler. JProfiler’s intuitive GUI helps you find performance bottlenecks, pin down memory leaks and resolve threading issues.
Exceptional ease of use
When you profile, you need the most powerful tool you can get. At the same time, you do not want to spend time learning how to use the tool. JProfiler is just that: simple and powerful at the same time.
Configuring sessions is straight-forward, third party integrations make getting started a breeze and profiling data is presented in a natural way. On all levels, JProfiler has been carefully designed to help you get started with solving your problems.
Real-time display of profiling data
With JProfiler you can immediately observe profiling data as your application is running. CPU, memory and thread profiling views are updated live and can be inspected without the need to wait for the measurement to complete.
For a large number of use-cases, this ability provides you with an extremely fast path to a solution. In addition, you can save snapshots at any time, interactively as well as programmatically.
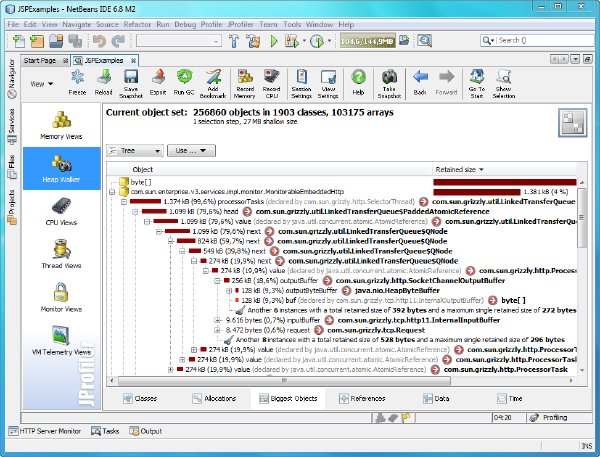
The unique heap walker
Finding a memory leak can be impossible without the right tool. JProfiler’s heap walker offers you an intuitive interface to solve both simple and complex memory problems. 5 different views show different aspects of the current set of objects.
Each view allows you to create new object sets based on the displayed data. Each view provides you with essential insights on the selected objects. Questions like why objects are not garbage collected are answered with a single click of the mouse.
The powerful CPU profiler
Fixing performance bottlenecks is the most frequent use case for a profiler. However, CPU data can be overwhelming in its level of detail and the way data is collected can make a huge difference in usability.
With JProfiler, you have a decisive advantage when trying to find the reason for a problem. Call tree view filters, aggregation levels and thread status selectors are just some examples of JProfiler’s versatility in this area.
The integrated thread profiler
Problems related to threading are much more frequent than one might assume. Without a thread profiler, you only have a minimal chance to tackle such issues.
A whole range of otherwise opaque problems can be solved when using JProfiler, such as increasing liveness in a multi-threaded application that uses too much locking. Thread profiling not only has a separate view section in JProfiler, it is also tightly integrated into the CPU profiling views.
Excellent support for Java Enterprise Edition
Dedicated support for JEE is present in most views in JProfiler. For example, in the JEE aggregation level you see the call tree in terms of the JEE components in your application.
Also, JProfiler adds a semantic layer on top of the low-level profiling data, like JDBC, JMS and JNDI calls that are presented in the CPU profiling views. With its JEE support, JProfiler bridges the gap between a code profiler and a high-level JEE monitoring tool.
Extensive QA capabilities
JProfiler is ideally suited as a QA tool, both during development as well as for dedicated QA teams. The rich functionality around snapshot comparisons makes it easy to track progress. JProfiler has strong support for command line operations.
This includes the ability to profile, export snapshot data and create snapshots comparisons from the command line. The ant tasks bundled with JProfiler allow you to perform all command line operations from your build script.
Broadest support for platforms, IDEs and application servers
JProfiler integrates into your environment: We provide native agent libraries for a wide range of platforms, both for 32-bit and 64-bit JVMs. Integrations into all popular IDEs makes profiling during development as easy as running your application.
And the large number of integrations wizards for nearly all application servers on the market ensures that you can get started with a few clicks and not with reading documentation.
Low overhead
JProfiler records data only when you need it. In fact, you can start your application with the JProfiler agent and attach the JProfiler GUI at a later time. When you do not record any data, the overhead is extremely small. That’s what we call on demand profiling.
Invariably, there are a lot of things you can adjust in an advanced profiler. JProfiler shows you how your profiling settings will impact performance and offers you templates to quickly select profiling settings for common use cases.
Extensibility
JProfiler is extensible. It is built on a well-documented platform that allows you to build your own custom profiler for special situations or your own analysis tool for snapshots.
With the interceptor API you can add additional semantic layers to the profiling data, similar to the built-in JDBC, JMS and JNDI profiling. The ready-to-run examples show you how easy it is to extend JProfiler with a few lines of code.
NOTE:
Users will be required a trial license key that can be requested here.
Here are some key features of “JProfiler”:
Live profiling of a local session:
· Once you define how your application is started, JProfiler can profile it and you immediately see live data from the profiled JVM. To eliminate the need for session configuration, you can use one of the many IDE plugins to profile the application from within your favorite IDE.
Live profiling of a remote session:
· By modifying the VM parameters of the java start command you can get any Java application to listen for a connection from the JProfiler GUI. The profiled application can not only run on your local computer, JProfiler can attach to a profiled application over the network. In addition, JProfiler provides numerous integration wizards for all popular application servers that help you in setting up your application for profiling.
Offline profiling:
· You do not have to connect with the JProfiler GUI to the profiled application in order to profile it: With offline profiling you can use JProfiler’s powerful trigger system or the JProfiler API to control the profiling agent and save snapshots to disk. At a later time you can open these snapshots in the JProfiler GUI or programmatically export profiling views with the command line export tool or the export ant task.
Snapshot comparisons:
· In JProfiler, you can save a snapshot of all current profiling data to disk. JProfiler offers a rich comparison facility to see what has changed between two or more snapshots. Alternatively you can create comparison reports programmatically with the command line comparison tool or the comparison ant task.
Viewing an HPROF snapshot:
· JProfiler can open HPROF snapshots that have been taken with JVM tools such as jconsole or jmap or that have been triggerd by the -XX:+HeapDumpOnOutOfMemoryError JVM parameter.
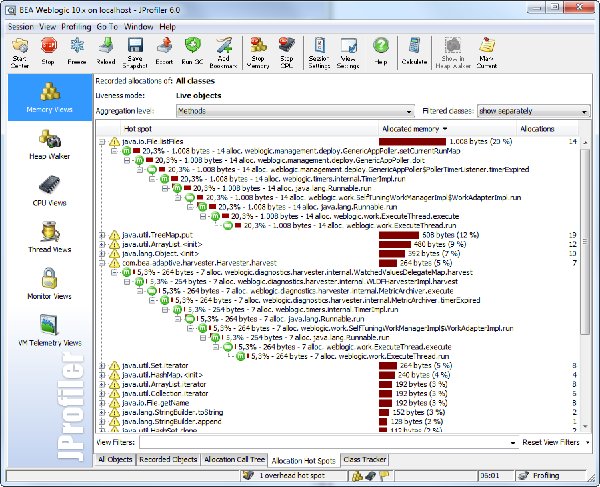
Memory profiling:
· JProfiler’s memory view section offers dynamically updated views on memory usage and views that show information about allocations spots. All views have several aggregation levels and can show live and garbage collected objects.
All objects:
· Shows classes or packages of all objects on the heap with instance counts and size information. You can mark current values and show differences.
Recorded objects:
· Shows classes or packages of all recorded objects. You can mark current values and show differences.
Allocation call tree:
· Shows a call tree or methods, classes, packages or Java EE components with annotated allocations of selected classes.
Allocation hot spots:
· Shows a list of methods, classes, packages or Java EE components that allocate selected classes. You can mark current values and show differences. The tree of backtraces can be shown for each hot spot.
Class tracker:
· Shows a timeline with a graph of instance counts for selected classes.
Heap walker:
Classes:
· Shows all classes and their instances.
· Allocations”
· Shows allocation tree and allocation hot spots for recorded objects.
Biggest objects:
· Shows the objects that block the largest parts of the heap from being garbage collected. The dominator tree can be expanded in place to show these retained objects.
References:
· Shows a graph of references for individual objects and offers a “show path to garbage collector root” functionality. Also offers cumulated views for incoming and outgoing references.
Data:
· Shows instance and class data for individual objects.
Time:
· Shows a time-resolved histogram of recorded objects.
CPU profiling:
Call tree:
· Shows a cumulated top-down tree of all recorded call sequences in the JVM. JDBC, JMS and JNDI service calls are annotated into the call tree. The call tree can be split for different request URL to a servlet or JSP. You can mark methods for “exceptional method run recording” and see the slowest invocations separatly.
Hot spots:
· Shows the list of the most time consuming methods. The tree of backtraces can be shown for each hot spot. Hotspots can be calculated for method calls, JDBC, JMS and JNDI service calls, as well as for URL invocations.
Call graph:
· Shows a graph of call sequences starting from selected methods, classes, packages or Java EE components.
Method statistics:
· Shows statistical information about the distribution of call times for all methods together with a call time distribution graph, that can be used to spot outliers.
Call tracer:
· Shows recorded chronological traces for method calls grouped by thread, package and class.
Thread profiling:
Thread history:
· Shows a timeline with thread activity and thread status.
Thread monitor:
· Shows a list of all live threads with their current activity.
Thread dumps:
· You can take multiple threads dumps and analyze them in the thread dumps view.
Monitor profiling:
Current locking graph:
· Shows a graph of all waiting and blocking situations in the JVM.
Current monitors:
· Shows the currently used monitors and their associated threads.
Locking history graph:
· Shows the history of recorded waiting and blocking situations as graphs.
Monitor history:
· Shows the history of recorded waiting and blocking events.
Monitor usage statistics:
· Shows statistics for monitors grouped by monitors, threads and classes of monitors.
VM telemetry:
Heap:
· Shows a timeline with a graph of the used heap and the heap size.
Recorded objects:
· Shows a timeline with a graph of live objects and arrays that have been recorded.
Recorded throughput:
· Shows a timeline with a graph of the rates of object creation and garbage collection for recorded objects.
GC activity:
· Shows a timeline with a graph of garbage collector activity.
Classes:
· Shows a timeline with a graph of loaded classes.
Threads:
· Shows a timeline with a graph of active threads.
CPU load:
· Shows a timeline with a graph of the CPU load generated by the profiled application.
homepage: http://www.ej-technologies.com/
||||||||||||||||||||||||||||||||||||||||||||||||||||||||||||||||||||||||||||||||||||||||||||||||||||||||||||||||||||||||||||||||||||||||||||||||||||||||||||||||||||||||||||||||||||||||||||||||||||||||||||||||||||||||||||||||||||||||||||||
更多資訊請點擊訪問

||||||||||||||||||||||||||||||||||||||||||||||||||||||||||||||||||||||||||||||||||||||||||||||||||||||||||||||||||||||||||||||||||||||||||||||||||||||||||||||||||||||||||||||||||||||||||||||||||||||||||||||||||||||||||||||||||||||||||||||
本資源下載鏈接來自ShareVirus
代碼
▄▓▄
▄▄█▀▀▀▀▀▀▀▀▀▀▀▀▀▀▀▀▀▀▀▀▀▀▀████ ▀ █▀▀▀▀▀▀▀▀▀▀▀▀▀▀▀▀▀▀▀█▄▄
▄▄█▀▀▀ ▄▄███████▀▀▀▀▀▀ ▀▀████ ████ █▀▀▀▀▀ ░▒▓█████████▀▀███▄▄ ▀▀█▄▄
█▀ ▄▄████▀ ▄▄▄▄▄▄▄▄▄▄▄ ░ ████░ ████ ▀ ████▄▄▄▄▄▄▄ ▀▀▓███▄ ▀▀████▄▄ ▀█▄
█ ▄█████▀ █████ ████░ ░ ████▒ ████▓ ░████ ████░ ▓████▓ ▀█████▄ █▄
█ ▄█████▓ ░ █████ ░ ████▒ ░ ████▓ █████ ▒███▓ ░ ████▒ ░ ▒█████ ░ ██████▄ █
█ ██████▒ ░ █████ ░ ████▓ ░ █████ █████ ▓███▓ ░ ████▓ ░ ░████▓ ░ ███████ █
█ ██████░ ░ █████ ░ █████ ░ █████ █████ ████▓ ░ █████ ░ ▐████▓ ░ ▓██████ █
█▀ ██████▌ ░ █████ ░ █████ ░ █████ ████▓ ████▓ ░ █████ ░ █████▓ ░ ▒██████ ▀█
█ ░██████▌ ████▓ ░ █████ ░ █████ ████▓ ████▓ █████ ░ █████▓ ░ ░██████░ █
█ ▒██████▀▀▀ ████▓ ░ █████ ░ ████▓ ████▓ █████▀▀▀▀▀▀▀▀ ░ ▀████▀ ▄ ▐██████▒ █
█ ▓██████ ░ ████▓ ░ █████ ░ ████▓ ████▓ ████▓ ░ ████░ ░ ▄ ░ ▄▄██ ▐██████▓ █
█▄▄▄▄▄▄ ▀█▄▄ ▓███▓ █████ ░ ████▓ ████▓ ▀███▒ ████▒ ░ █ ▒ █ █ ▄▀▀ ▄▄▄▄▄▄█
▀█▄▄▄▄▄ ▀▀▀█████████ ░ ████▓ ▀▀▀▀▀▀ ▀▀▀████████▀ ░ █ ▓ █ █▄▄▄█▀▀ pnx!
▀▀▀▀█▄▄▄▄ ▀▀▀██▄ ▀▀▀▀▀▀ █▀▀▀▀▀▀█▄▄▄▄ ▀▀▀██▄▄ █▄▄▄█
▀▀▀█▄▄ ▀▀▄ █▀▀▀▀▀▀ ▀▀▀█▄▄ ▀▀▄ █
▀▀█▄▄▄█ ▀▀█▄▄▄█
FALLEN Presents ...
╓────────────────────────────────────────────────────────────────────────╖
║ JProfiler v6.1.3 (C) EJ Technologies ║
╓─║───────────────────────────────────╥────────────────────────────────────║─╖
║│║ Supplied By...........TEAM FALLEN ║ Operating System.............Win32 ║│║
║│║ Cracked By............TEAM FALLEN ║ Protection..................serial ║│║
║│║ Packed By.............TEAM FALLEN ║ Crack Type..................keygen ║│║
║│║ Date ..................01.20.2011 ║ Release Size...............8x5.0MB ║│║
╙─║───────────────────────────────────╨────────────────────────────────────║─╜
╙────────────────────────────────────────────────────────────────────────╜
╓────────────────────────────────────────────────────────────────────────╖
╓─║────────────────────────────п RELEASE iNFO о────────────────────────────║─╖
║│║────────────────────────────────────────────────────────────────────────║│║
║│║ JProfiler is an award-winning all-in-one Java profiler. JProfiler's ║│║
║│║ intuitive GUI helps you find performance bottlenecks, pin down memory ║│║
║│║ leaks and resolve threading issues. ║│║
║│║ ║│║
║│║ http://www.ej-technologies.com/ ║│║
╙─║ ║│║
║────────────────────────────────────────────────────────────────────────║─╜
╓─║────────────────────────────п iNSTALLATiON о────────────────────────────║─╖
║│║────────────────────────────────────────────────────────────────────────║│║
║│║ Read install.txt from crack.zip ║│║
║│║ ║│║
╙─║ ║─╜
║────────────────────────────────────────────────────────────────────────║
║────────────────────────────────────────────────────────────────────────║
╓─║───────────────────────────────п GREETS о───────────────────────────────║─╖
║│║────────────────────────────────────────────────────────────────────────║│║
║│║ UCF · PWA · LND · TMG · TFA · DAMN ║│║
╙─║ ║─╜
║────────────────────────────────────────────────────────────────────────║
╓─║─────────────────────────────п FALLEN.NFO о─────────────────────────────║─╖
║│║────────────────────────────────────────────────────────────────────────║│║
║│║ 1998 - 2011 ║│║
╙─║ Last Updated ...............................................01.01.2011 ║─╜
╙────────────────────────────────────────────────────────────────────────╜

本資源帖謝絕任何廣告及與資源無關的評論,凡涉及廣告內容的評論一概刪除處理!
.
英文名: EJ-Technologies JProfiler
資源格式: 壓縮包
版本: v6.1.3 x86/x64
發行時間: 2011年
制作發行: ej-technologies GmbH
地區: 德國
語言: 英文
簡介:
JProfiler是一個全功能的Java剖析工具(profiler),專用於分析J2SE和J2EE應用程序。它把對CPU、執行線程和內存的剖析組合在一個強大的應用中。JProfiler的GUI可以讓你方便的找到效能瓶頸、內存洩漏(memory leaks)、並解決執行線程的問題。
JProfiler is an award-winning all-in-one Java profiler. JProfiler’s intuitive GUI helps you find performance bottlenecks, pin down memory leaks and resolve threading issues.
Exceptional ease of use
When you profile, you need the most powerful tool you can get. At the same time, you do not want to spend time learning how to use the tool. JProfiler is just that: simple and powerful at the same time.
Configuring sessions is straight-forward, third party integrations make getting started a breeze and profiling data is presented in a natural way. On all levels, JProfiler has been carefully designed to help you get started with solving your problems.
Real-time display of profiling data
With JProfiler you can immediately observe profiling data as your application is running. CPU, memory and thread profiling views are updated live and can be inspected without the need to wait for the measurement to complete.
For a large number of use-cases, this ability provides you with an extremely fast path to a solution. In addition, you can save snapshots at any time, interactively as well as programmatically.
The unique heap walker
Finding a memory leak can be impossible without the right tool. JProfiler’s heap walker offers you an intuitive interface to solve both simple and complex memory problems. 5 different views show different aspects of the current set of objects.
Each view allows you to create new object sets based on the displayed data. Each view provides you with essential insights on the selected objects. Questions like why objects are not garbage collected are answered with a single click of the mouse.
The powerful CPU profiler
Fixing performance bottlenecks is the most frequent use case for a profiler. However, CPU data can be overwhelming in its level of detail and the way data is collected can make a huge difference in usability.
With JProfiler, you have a decisive advantage when trying to find the reason for a problem. Call tree view filters, aggregation levels and thread status selectors are just some examples of JProfiler’s versatility in this area.
The integrated thread profiler
Problems related to threading are much more frequent than one might assume. Without a thread profiler, you only have a minimal chance to tackle such issues.
A whole range of otherwise opaque problems can be solved when using JProfiler, such as increasing liveness in a multi-threaded application that uses too much locking. Thread profiling not only has a separate view section in JProfiler, it is also tightly integrated into the CPU profiling views.
Excellent support for Java Enterprise Edition
Dedicated support for JEE is present in most views in JProfiler. For example, in the JEE aggregation level you see the call tree in terms of the JEE components in your application.
Also, JProfiler adds a semantic layer on top of the low-level profiling data, like JDBC, JMS and JNDI calls that are presented in the CPU profiling views. With its JEE support, JProfiler bridges the gap between a code profiler and a high-level JEE monitoring tool.
Extensive QA capabilities
JProfiler is ideally suited as a QA tool, both during development as well as for dedicated QA teams. The rich functionality around snapshot comparisons makes it easy to track progress. JProfiler has strong support for command line operations.
This includes the ability to profile, export snapshot data and create snapshots comparisons from the command line. The ant tasks bundled with JProfiler allow you to perform all command line operations from your build script.
Broadest support for platforms, IDEs and application servers
JProfiler integrates into your environment: We provide native agent libraries for a wide range of platforms, both for 32-bit and 64-bit JVMs. Integrations into all popular IDEs makes profiling during development as easy as running your application.
And the large number of integrations wizards for nearly all application servers on the market ensures that you can get started with a few clicks and not with reading documentation.
Low overhead
JProfiler records data only when you need it. In fact, you can start your application with the JProfiler agent and attach the JProfiler GUI at a later time. When you do not record any data, the overhead is extremely small. That’s what we call on demand profiling.
Invariably, there are a lot of things you can adjust in an advanced profiler. JProfiler shows you how your profiling settings will impact performance and offers you templates to quickly select profiling settings for common use cases.
Extensibility
JProfiler is extensible. It is built on a well-documented platform that allows you to build your own custom profiler for special situations or your own analysis tool for snapshots.
With the interceptor API you can add additional semantic layers to the profiling data, similar to the built-in JDBC, JMS and JNDI profiling. The ready-to-run examples show you how easy it is to extend JProfiler with a few lines of code.
NOTE:
Users will be required a trial license key that can be requested here.
Here are some key features of “JProfiler”:
Live profiling of a local session:
· Once you define how your application is started, JProfiler can profile it and you immediately see live data from the profiled JVM. To eliminate the need for session configuration, you can use one of the many IDE plugins to profile the application from within your favorite IDE.
Live profiling of a remote session:
· By modifying the VM parameters of the java start command you can get any Java application to listen for a connection from the JProfiler GUI. The profiled application can not only run on your local computer, JProfiler can attach to a profiled application over the network. In addition, JProfiler provides numerous integration wizards for all popular application servers that help you in setting up your application for profiling.
Offline profiling:
· You do not have to connect with the JProfiler GUI to the profiled application in order to profile it: With offline profiling you can use JProfiler’s powerful trigger system or the JProfiler API to control the profiling agent and save snapshots to disk. At a later time you can open these snapshots in the JProfiler GUI or programmatically export profiling views with the command line export tool or the export ant task.
Snapshot comparisons:
· In JProfiler, you can save a snapshot of all current profiling data to disk. JProfiler offers a rich comparison facility to see what has changed between two or more snapshots. Alternatively you can create comparison reports programmatically with the command line comparison tool or the comparison ant task.
Viewing an HPROF snapshot:
· JProfiler can open HPROF snapshots that have been taken with JVM tools such as jconsole or jmap or that have been triggerd by the -XX:+HeapDumpOnOutOfMemoryError JVM parameter.
Memory profiling:
· JProfiler’s memory view section offers dynamically updated views on memory usage and views that show information about allocations spots. All views have several aggregation levels and can show live and garbage collected objects.
All objects:
· Shows classes or packages of all objects on the heap with instance counts and size information. You can mark current values and show differences.
Recorded objects:
· Shows classes or packages of all recorded objects. You can mark current values and show differences.
Allocation call tree:
· Shows a call tree or methods, classes, packages or Java EE components with annotated allocations of selected classes.
Allocation hot spots:
· Shows a list of methods, classes, packages or Java EE components that allocate selected classes. You can mark current values and show differences. The tree of backtraces can be shown for each hot spot.
Class tracker:
· Shows a timeline with a graph of instance counts for selected classes.
Heap walker:
Classes:
· Shows all classes and their instances.
· Allocations”
· Shows allocation tree and allocation hot spots for recorded objects.
Biggest objects:
· Shows the objects that block the largest parts of the heap from being garbage collected. The dominator tree can be expanded in place to show these retained objects.
References:
· Shows a graph of references for individual objects and offers a “show path to garbage collector root” functionality. Also offers cumulated views for incoming and outgoing references.
Data:
· Shows instance and class data for individual objects.
Time:
· Shows a time-resolved histogram of recorded objects.
CPU profiling:
Call tree:
· Shows a cumulated top-down tree of all recorded call sequences in the JVM. JDBC, JMS and JNDI service calls are annotated into the call tree. The call tree can be split for different request URL to a servlet or JSP. You can mark methods for “exceptional method run recording” and see the slowest invocations separatly.
Hot spots:
· Shows the list of the most time consuming methods. The tree of backtraces can be shown for each hot spot. Hotspots can be calculated for method calls, JDBC, JMS and JNDI service calls, as well as for URL invocations.
Call graph:
· Shows a graph of call sequences starting from selected methods, classes, packages or Java EE components.
Method statistics:
· Shows statistical information about the distribution of call times for all methods together with a call time distribution graph, that can be used to spot outliers.
Call tracer:
· Shows recorded chronological traces for method calls grouped by thread, package and class.
Thread profiling:
Thread history:
· Shows a timeline with thread activity and thread status.
Thread monitor:
· Shows a list of all live threads with their current activity.
Thread dumps:
· You can take multiple threads dumps and analyze them in the thread dumps view.
Monitor profiling:
Current locking graph:
· Shows a graph of all waiting and blocking situations in the JVM.
Current monitors:
· Shows the currently used monitors and their associated threads.
Locking history graph:
· Shows the history of recorded waiting and blocking situations as graphs.
Monitor history:
· Shows the history of recorded waiting and blocking events.
Monitor usage statistics:
· Shows statistics for monitors grouped by monitors, threads and classes of monitors.
VM telemetry:
Heap:
· Shows a timeline with a graph of the used heap and the heap size.
Recorded objects:
· Shows a timeline with a graph of live objects and arrays that have been recorded.
Recorded throughput:
· Shows a timeline with a graph of the rates of object creation and garbage collection for recorded objects.
GC activity:
· Shows a timeline with a graph of garbage collector activity.
Classes:
· Shows a timeline with a graph of loaded classes.
Threads:
· Shows a timeline with a graph of active threads.
CPU load:
· Shows a timeline with a graph of the CPU load generated by the profiled application.
homepage: http://www.ej-technologies.com/
||||||||||||||||||||||||||||||||||||||||||||||||||||||||||||||||||||||||||||||||||||||||||||||||||||||||||||||||||||||||||||||||||||||||||||||||||||||||||||||||||||||||||||||||||||||||||||||||||||||||||||||||||||||||||||||||||||||||||||||
更多資訊請點擊訪問
||||||||||||||||||||||||||||||||||||||||||||||||||||||||||||||||||||||||||||||||||||||||||||||||||||||||||||||||||||||||||||||||||||||||||||||||||||||||||||||||||||||||||||||||||||||||||||||||||||||||||||||||||||||||||||||||||||||||||||||
本資源下載鏈接來自ShareVirus
代碼
▄▓▄
▄▄█▀▀▀▀▀▀▀▀▀▀▀▀▀▀▀▀▀▀▀▀▀▀▀████ ▀ █▀▀▀▀▀▀▀▀▀▀▀▀▀▀▀▀▀▀▀█▄▄
▄▄█▀▀▀ ▄▄███████▀▀▀▀▀▀ ▀▀████ ████ █▀▀▀▀▀ ░▒▓█████████▀▀███▄▄ ▀▀█▄▄
█▀ ▄▄████▀ ▄▄▄▄▄▄▄▄▄▄▄ ░ ████░ ████ ▀ ████▄▄▄▄▄▄▄ ▀▀▓███▄ ▀▀████▄▄ ▀█▄
█ ▄█████▀ █████ ████░ ░ ████▒ ████▓ ░████ ████░ ▓████▓ ▀█████▄ █▄
█ ▄█████▓ ░ █████ ░ ████▒ ░ ████▓ █████ ▒███▓ ░ ████▒ ░ ▒█████ ░ ██████▄ █
█ ██████▒ ░ █████ ░ ████▓ ░ █████ █████ ▓███▓ ░ ████▓ ░ ░████▓ ░ ███████ █
█ ██████░ ░ █████ ░ █████ ░ █████ █████ ████▓ ░ █████ ░ ▐████▓ ░ ▓██████ █
█▀ ██████▌ ░ █████ ░ █████ ░ █████ ████▓ ████▓ ░ █████ ░ █████▓ ░ ▒██████ ▀█
█ ░██████▌ ████▓ ░ █████ ░ █████ ████▓ ████▓ █████ ░ █████▓ ░ ░██████░ █
█ ▒██████▀▀▀ ████▓ ░ █████ ░ ████▓ ████▓ █████▀▀▀▀▀▀▀▀ ░ ▀████▀ ▄ ▐██████▒ █
█ ▓██████ ░ ████▓ ░ █████ ░ ████▓ ████▓ ████▓ ░ ████░ ░ ▄ ░ ▄▄██ ▐██████▓ █
█▄▄▄▄▄▄ ▀█▄▄ ▓███▓ █████ ░ ████▓ ████▓ ▀███▒ ████▒ ░ █ ▒ █ █ ▄▀▀ ▄▄▄▄▄▄█
▀█▄▄▄▄▄ ▀▀▀█████████ ░ ████▓ ▀▀▀▀▀▀ ▀▀▀████████▀ ░ █ ▓ █ █▄▄▄█▀▀ pnx!
▀▀▀▀█▄▄▄▄ ▀▀▀██▄ ▀▀▀▀▀▀ █▀▀▀▀▀▀█▄▄▄▄ ▀▀▀██▄▄ █▄▄▄█
▀▀▀█▄▄ ▀▀▄ █▀▀▀▀▀▀ ▀▀▀█▄▄ ▀▀▄ █
▀▀█▄▄▄█ ▀▀█▄▄▄█
FALLEN Presents ...
╓────────────────────────────────────────────────────────────────────────╖
║ JProfiler v6.1.3 (C) EJ Technologies ║
╓─║───────────────────────────────────╥────────────────────────────────────║─╖
║│║ Supplied By...........TEAM FALLEN ║ Operating System.............Win32 ║│║
║│║ Cracked By............TEAM FALLEN ║ Protection..................serial ║│║
║│║ Packed By.............TEAM FALLEN ║ Crack Type..................keygen ║│║
║│║ Date ..................01.20.2011 ║ Release Size...............8x5.0MB ║│║
╙─║───────────────────────────────────╨────────────────────────────────────║─╜
╙────────────────────────────────────────────────────────────────────────╜
╓────────────────────────────────────────────────────────────────────────╖
╓─║────────────────────────────п RELEASE iNFO о────────────────────────────║─╖
║│║────────────────────────────────────────────────────────────────────────║│║
║│║ JProfiler is an award-winning all-in-one Java profiler. JProfiler's ║│║
║│║ intuitive GUI helps you find performance bottlenecks, pin down memory ║│║
║│║ leaks and resolve threading issues. ║│║
║│║ ║│║
║│║ http://www.ej-technologies.com/ ║│║
╙─║ ║│║
║────────────────────────────────────────────────────────────────────────║─╜
╓─║────────────────────────────п iNSTALLATiON о────────────────────────────║─╖
║│║────────────────────────────────────────────────────────────────────────║│║
║│║ Read install.txt from crack.zip ║│║
║│║ ║│║
╙─║ ║─╜
║────────────────────────────────────────────────────────────────────────║
║────────────────────────────────────────────────────────────────────────║
╓─║───────────────────────────────п GREETS о───────────────────────────────║─╖
║│║────────────────────────────────────────────────────────────────────────║│║
║│║ UCF · PWA · LND · TMG · TFA · DAMN ║│║
╙─║ ║─╜
║────────────────────────────────────────────────────────────────────────║
╓─║─────────────────────────────п FALLEN.NFO о─────────────────────────────║─╖
║│║────────────────────────────────────────────────────────────────────────║│║
║│║ 1998 - 2011 ║│║
╙─║ Last Updated ...............................................01.01.2011 ║─╜
╙────────────────────────────────────────────────────────────────────────╜
本資源帖謝絕任何廣告及與資源無關的評論,凡涉及廣告內容的評論一概刪除處理!
.
- 上一頁:《Fortran集成開發環境》(Approximatrix Simply Fortran)v1.9.467[壓縮包]
- 下一頁:《Web開發控件套裝產品》(ComponentOne Studio)for Silverlight 4 2010 v3.0[壓縮包]
相關資源:


- [應用軟件]《思維粒子》(Thinking Particles)v4.0 SP1[壓縮包]
- [安全相關軟件]《麥咖啡防病毒軟件大企業版》(McAfee VirusScan Enterprise)更新v8.7i.with.Patch.4多國語言零售版[壓縮包]
- [行業軟件]《兒童學畫畫軟件下載》(TuxPaint for veket)0.92[安裝包]
- [應用軟件]《超級急救盤》2005.12.30,應用軟件、資源下載
- [系統工具]《磁盤鏡像工具》(Drive SnapShot)更新v1.40.0.15419/含注冊機[壓縮包]
- [行業軟件]《電磁三維軟件》(MemResearch EM3DS v2008)[壓縮包]
- [應用軟件]《網站模板設計軟件》(Artisteer)v2.6.0.35446/多國語言版/含注冊器[安裝包]
- [軟件綜合]C語言VC++6.0
- [應用軟件]《漢王文豪5800》,應用軟件、資源下載
- [行業軟件]《藥物研發可視化仿真》(Molecular Operating Environment v2008.10)[光盤鏡像],行業軟件、資源下載
- [應用軟件]《拉魯斯多媒體字典2010》(Petit Larousse 2010)[光盤鏡像]
- [學習課件]《劊子手世家》清晰掃描版[PDF] 資料下載
- [光盤游戲]《蜘蛛俠3》(Spider-Man 3)[ISO]
- [其他圖書]《陳子工筆人物畫精品》pdf
- [文學圖書]《《漢書》精言》(朱紹侯)掃描版[PDF]
- [生活圖書]《每天幸福一點點大全集》掃描版[PDF]
- [人文社科]《暢談東方智慧》掃描版[PDF]
- [計算機與網絡]《Corel Painter 11插畫設計與繪制標准實訓教程》彩圖版[PDF]
- [人文社科]Vlidge(絕代雙V) -《Vlidge II》專輯[MP3+APE]
- [人文社科]《設計師談建築色彩設計》清晰掃描版[PDF]
- 《XML集成開發環境》(Stylus Studio 2006 Release 3 XML Enterprise Edition),編程開發、資源下載
- 《LoadRunner 8.0 工業級測試工具》(LoadRunner 8.0)8
- 安卓Android入門基礎就業班#76期安卓Android視頻教程
- 《軟件開發》(BASIS Product Suite)[光盤鏡像],編程開發、資源下載
- 《CAD軟件》(cycas for veket)3.9[安裝包],行業軟件、資源下載
- 《地球物理勘探軟件》(Hampson Russell CE8 R4.3 X86/X64)[光盤鏡像],行業軟件、資源下載
- 《Visual Studio 2005 Professional+MSDN》(Visual Studio 2005 Professional+MSDN)DVD竟像[英文版][ISO],編程開發、資源下載
- 《企業產品數據管理軟件》(SolidWorks Enterprise PDM 2010 SP0 x86_x64 多國語言含中文)[光盤鏡像],行業軟件、資源下載
- 《建立觸摸屏應用程序》(Embarcadero RAD Studio )V2010[光盤鏡像],編程開發、資源下載
- 《ZendStudio-5_5_0Beta.exe》(ZendStudio-5_5_0Beta.exe)5.5.0a (2.11日更新5.5a版本)
- 《Macrovision FLEXnet AdminStudio 7.5 安裝制作管理》(Macrovision FLEXnet AdminStudio 7.5 )英文[ISO]
- 《LoadRunner 9.5 / 8.1 / 7.8 工業級軟件測試工具 之 永不重裝版 全套收錄》(LoadRunner Cloud Edition Complete Collection)[壓縮
免責聲明:本網站內容收集於互聯網,本站不承擔任何由於內容的合法性及健康性所引起的爭議和法律責任。如果侵犯了你的權益,請通知我們,我們會及時刪除相關內容,謝謝合作! 聯系信箱:[email protected]
Copyright © 電驢下載基地 All Rights Reserved