- 下載位址: [www.ed2k.online][GraphPad.Prism.v5.0.注冊版].prism[www.xuexi111.com].rar
- 下載位址: [www.ed2k.online][GraphPad.Prism.v5.0.注冊版].keygen[www.xuexi111.com].exe
- 下載位址: [www.ed2k.online]Prism.用戶手冊[www.xuexi111.com].pdf
- 下載位址: [www.ed2k.online]Prism.案例手冊[www.xuexi111.com].pdf
- 下載位址: [www.ed2k.online][GraphPad.Prism.v5.0.].[GraphPad.Prism.v5.0.].GraphPad.Prism.statistics.help[www.xuexi111.com].pdf
- 下載位址: [www.ed2k.online][GraphPad.Prism.v5.0.].[GraphPad.Prism.v5.0.].GraphPad.Prism.RegressionBook[www.xuexi111.com].pdf
資料介紹
相關專題學習資料:- CAD輔助設計軟件工具
中文介紹
Prism 繪圖統計分析軟件。特色:繪圖迅速、頁面編排容易、最容易使用的Curve fitting(具有線性及非線性功能)、內建統計功能及統計輔助輔導員、各種2D繪圖方式。InStat統計軟件,會一步一步的協助您,清楚的分析選項,獨特的分析檢查條列讓您更容易了解結果。
StatMate 統計軟件,搭配Prism及InStat. StatMate使用,提供八種統計計算。
Prism 5的新特點
新外觀和感覺
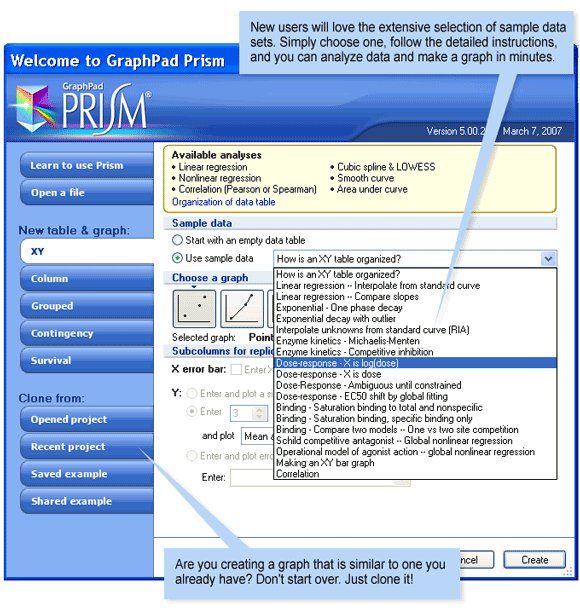
Prism 5讓你更高效地工作。新的工具欄按鈕使每個特點更容易訪問,不需要通過向下拉菜單搜索你想要的。也可以嘗試點擊新的鼠標右鍵菜單快速容易地編輯,我們增加了許多新工具幫助你是項目井然有序。
Prism魔術棒
你曾想讓一個圖表(或許多圖表)看起來和另一個一樣嗎?Prism Magic能很容易做到。選擇你想要更改的圖表,從Prism project,裡選擇一個示例圖表,預覽你選擇的更改。當你滿意預覽時,點擊OK你就會有一個與之匹配的圖表。
Prism 5 操作平台:Windows 2000, XP or Vista;Macintosh
英文介紹
GraphPad Prism is a powerful combination of biostatistics, curve fitting (nonlinear regression) and scientific graphing in one comprehensive program. Easily organize, analyze and graph repeated experiments; pick appropriate statistical tests and interpret the results. Windows or Macintosh.
GraphPad Prism is a powerful combination of basic biostatistics, curve fitting and scientific graphing in one comprehensive program. Because it easily organizes, analyzes and graphs repeated experiments; picks appropriate statistical tests; and interprets the results, Prism is ideally suited to data plotting and analysis applications in the life sciences.
Prism Features
GraphPad Prism V 5 is available for both Windows and Macintosh. The two versions are very similar. You can open files created on one platform on the other platform with no special conversion. The program has almost identical interfaces on the two platforms, so you can switch back and forth with virtually no learning curve. The main difference is that the Mac version does not support Object Linking and Embedding (OLE).
Curve fitting features:
Equations
Marquardt-Levenberg nonlinear regression.
Fit data to a built-in classic equation, choose from an equation library, or enter your own.
Built-in equations include kinetic equations (exponential decay, growth, association), equilibrium mass action equations (binding isotherm, sigmoidal dose-response, competitive binding including 2 site), polynomial up to 4th order, Gaussian distribution, power series and sine.
Enter multiple-line user-defined equations, including If-Then clauses. Define different equations for different data sets (columns).
Generate a family of theoretical curves.
Create equation libraries to distribute to others.
Fitting options
Automatic initial values.
Fit to replicate Y values or mean Y.
Fix any parameter to a constant value or constrain to a range of values.
Weight by 1/Y, 1/Y2, 1/X, 1/X2, 1/SD2 distances.
Fit data to two equations and compare fits with an F test. Automatically graph the best fit.
Global fitting. Fit several data sets at once, sharing selected parameters between the data sets.
Compare two curves by comparing the sum of squares when selected parameters are shared between the data sets with the individual sum of squares.
Compare models (and data sets) using the extra sum-of-squares F test or Akaike’s Information Criterion (AIC).
Output options
Comprehensive results include value of parameters with SEM and 95% CI, df, R2, sum of squares, and residuals (Sy.x).
Perform a runs test for goodness-of-fit.
Calculate (and graph) residuals.
Use any curve as a standard curve. Calculate Y from X, or X from Y.
Calculate dose-ratios for Schild plot.
Compute Ki from IC50 (method of Cheng and Prusoff).
Table of XY coordinates defining the curve.
Customizable summary table of best-fit values.
Data management features:
Data entry
Enter Y data as raw replicates or mean, SD/SEM and N.
Automatic updating of analyses and graphs as data change.
Enter up to 104 related data sets on one table to be analyzed and plotted together. Up to 52 replicates and any number of points per data set
Accurately accounts for missing values.
Exclude specified points from analyses and graphs (they show on the table in blue italics, but are ignored by the analyses and graphs).
Transfer data to and from Excel and other applications with the clipboard, or import and export text (ASCII) files.
Data Importing
Import text files and retain the link. Double click on the Prism data to edit the text file.
Choose rows and columns to import.
Filter row. Choose to start importing after a condition is met, and to stop importing when another condition is met.
Filter columns. Choose a range of columns to import.
Decimate. Skip several rows after every row that is imported.
Unstack indexed data.
Transpose rows and columns.
Import free-form notes and structured info constants along with data.
Use Excel data in Prism
Copy and paste data and results between Prism and Excel.
Paste a link from Excel into Prism. Double-click on the Prism data to return to Excel (Windows only).
Embed an entire spreadsheet file within a Prism file (Windows only).
Import Excel files directly (Windows only).
Data preprocessing
Normalize, sort or transpose data.
Subtract (or divide by) a baseline or compute relative changes.
Consolidate related data sets by calculating means or totals.
Transform data with a full range of mathematical functions, including user-defined transforms.
Smooth curves, or convert to their derivative or integral.
Info tables
Use Info tables to record experimental details such as experiment or lot number, or enter numerical constants (such as concentration) that can be used in analyses.
Link each info table, with associated free-form notes, to particular data table or to the entire project.
Enter the info constants manually or import from text files along with your data.
Use values entered on info sheets as constants in nonlinear regression or transforms, or as titles and text objects.
Efficiently analyze repeat experiments
Instantly analyze and graph a new data table exactly as you have already analyzed and graphed another data table in the project.
Save analysis and graphing steps in templates and methods files, to be used in new projects.
Run Prism scripts to automate importing, analyzing and graphing a large series of experiments.
Statistics features:
Linear regression and correlation
Calculate slope and intercept with confidence intervals
Force the regression line through a specified point
Fit to replicate Y values or mean Y
Test for departure from linearity with a runs test
Calculate and graph residuals
Compare slopes and intercepts of two or more regression lines
Determine new points along the standard curve
Pearson or Spearman (nonparametric) correlation
Table of XY coordinates
Column statistics
Calculate min, max, quartiles, mean, SD, SEM, CI, CV, Geometric mean with Confidence Intervals
Specify desired level of confidence
Frequency distributions (bin to histogram), including cumulative histograms.
Kolgoromov-Smirnov normality test
One sample t test or Wilcoxon test to compare the column mean (or median) with a theoretical value
Skewness and Kurtosis
Statistical comparisons
Kaplan-Meier survival analysis. Compare curves with the log-rank test (including test for trend)
Paired or unpaired t tests
Mann-Whitney or Wilcoxon tests
Ordinary or repeated measures one-way ANOVA with Tukey, Newman-Keuls, Dunnett or Bonferroni post tests, or the post-test for trend
Kruskal-Wallis or Friedman nonparametric one-way ANOVA with Dunn’s post test
Fisher’s exact test or the chi-square test. Calculate the relative risk and odds ratio with confidence intervals
Two-way ANOVA, even with missing values with some post tests
Repeated measures two-way ANOVA with some post tests
Clinical (diagnostic) lab statistics
Bland-Altman plots
Receiver operator characteristic (ROC) curves
Deming regression (type ll linear regression)
Graphing features:
Axes and ticks
Linear, log10, or log2 scale, ascending or descending numbering.
Segment axes with up to two breaks (gaps) per axis.
Select orientation of tick marks and adjust major and minor intervals. Choose tick length.
Label ticks using decimal, scientific, 10^X, or notation.
Place custom ticks and labels anywhere on an axis.
Offset X and Y axes.
Add a right-hand Y axis.
Choose number of decimal points for axis numbering.
Precede axis numbers with a prefix (i.e. ’$’) and follow with a suffix (i.e. ’%’)
Numbering under X axis can be at any angle.
Move numbering and axis title closer to, or further from, the axis.
Symbols, lines, and graph types
XY graphs, bar graphs (vertical or horizontal), box-and-whisker plots, and scatter plots.
Plot hundreds data sets on a single graph. Add or remove data sets.
Create graphs with no frame, a plain frame, a frame with ticks, or a frame with a grid.
Adjust size and shape of graph by specifying dimensions or dragging with the mouse.
14 different symbols in 9 sizes.
5 line patterns (dotted, dashed, etc.) in 7 line thicknesses and 16 colors.
Connect points with a line, staircase, or spline curve.
Start point-to-point lines at the origin or the first data point.
Change origin position: lower left, automatically selected, or custom.
Built-in drawing tools--lines, arrows, boxes, circles, ovals, and arcs.
Error bars
Automatic calculation of error bars from replicate values.
Plot mean and SD, mean and SEM, mean and 95% CI, mean and range, median and range, or median and interquartile range.
Error bars can be above or below the point, or both, and with caps or without.
Specify error bar thickness.
Option to suppress error bars.
Text and legends
Automatic legends that are customizable.
Easily access Greek letters, mathematical symbols, or international characters.
Rotate text any angle.
Add underlining, bold, super and subscripts, or change point size easily from the tool bar.
Move graph and axis titles without losing centering.
Page layout features:
Graph arrangement
Built-in page layout templates for automatic arrangement of multiple graphs.
Move, resize, delete or add graphs.
Include data, results tables and graphs on one page.
Import images as .TIF, .PCX, .BMP, .JPG .GIF, .WMF (Windows) or PICT (Mac) files.
Create portrait and landscape pages in one file.
Tools to equalize the size, and align axes, of several graphs.
6 levels of zoom.
Layouts will automatically update when you edit a graph or data plotted on the graph – even if the graph comes from a different Prism file.
Page enhancements
Draw lines, arrows, boxes, circles, ovals and arcs.
Add text, including Greek letters and super- or subscripts.
Align objects (left, right, center, top, bottom) or align graphs by X or Y axes.
Send to back. Bring to front.
Duplicate objects or groups of objects.
Group and ungroup objects.
Use rulers, snap to guidelines, superimpose grid.
Choose any color for any data set or object, and define your own palette of custom colors.
Embed OLE objects, such as equations and WordArt. (Windows only)
Embed data and results tables on graphs or page layouts
Paste any portion of a data, results or info table onto a graph or layout.
Customize the table with a border, grid lines, or titles.
Create text tables as well as numerical tables.
Place any number of tables on one graph or layout page.
Prism automatically updates tables when you edit the data.
Publication quality output
Print in color or black and white.
Copy and paste into Word or PowerPoint.
One-click copy and paste into a new slide in PowerPoint (Windows only).
Embed or link a Prism graph into PowerPoint or Word using OLE (Windows only).
Export as a wmf (Windows) or pict (Mac) file.
Export as a bitmap in png, bmp, jpg, or tif format at up to 1200 dots per inch.
Choose RGB or CMYK colors. Choose whether to include background color in exported file.
Email an entire file, or just one page, right from Prism (Windows only).
Post one graph or layout, or all graphs or layouts, to a web server.
What makes Prism truly unique, however, is not just what it does, but how it does it! Designed for laboratory and clinical researchers, Prism doesn’t expect you to be a statistician. It guides you through the analysis process – giving you as much help as you need – and tracks and organizes like no other program available. You can concentrate on your data, not on figuring out how to use the program.
Need to see for yourself? Our free demo version lets you try Prism with your own data. Download the fully functional Prism demo and use it for 30 days for free. It’s the best way to see if Prism is the right choice for you.
We guarantee your satisfaction. If Prism does not meet or exceed your expectations, return it within 90 days of purchase for a fast, courteous refund.
Publishing graphs with Prism
We designed Prism to produce quality graphs. There are a variety of options that are available for publishing your graphs.
Copy/Paste. With many applications you can simply Copy your Prism graph and Paste it into another application. With Prism Windows, you’ll be pasting a Prism object that includes all data and results. Double-click on the pasted graph to edit it with Prism.
Export your graphs from Prism in the format that best suits your needs. Choose from:
TIF – High resolution tif files at up to 1200 DPI in CMYK or RGB for publcation
JPEG – web format
WMF – Windows Metafile, Windows only
PICT – Macintosh only
PNG – web format
BMP – bit map format
PCX – bit map format
Post to web sever. With one click you can post your graphs to the web. Simply email the link to your collegues for them to view.
Powerpoint and Word – Prism is designed to work hand-in-hand with Office applications, seamlessly exchanging data and graphics with Word and PowerPoint
Well-organized so you can organize well!
With Prism, you can store all parts of an experiment (several data tables linked to results, graphs, page layouts and notes) in one organized file. You can decide how much information to include in one project file. You can place all your data tables into one file, along with linked results and graphs. Or you can also separate your work into lots of files. Prism lets you choose how to organize your work.
Record experimental details
Because science requires rigorous record keeping, Prism lets you enter unstructured notes and structured data (notebook number, experimenter, lot number, concentration, etc.) onto Info sheets. It’s an ideal way to keep each part of your experiment organized and on target. Each info sheet can be linked to a particular data table or be general for the entire project. You can use info constants as constants in transforms, as constraints in nonlinear regression, and as graph titles and legends.
Automatic linking
Save time and help eliminate errors with automatic linking.
If you edit data, Prism automatically recomputes linked analyses and replots linked graphs.
If you exclude a ’bad’ data point, it will remain on the data table (in blue italics) but be omitted from analyses and graphs, which are automatically updated.
If you change analysis choices, the results are recomputed (along with any chained analyses) and linked graphs updated.
If you edit info constants, Prism automatically recomputes linked analyses and recreates graphs where those info constants are used.
If you edit a graph, Prism automatically redraws linked page layouts, even if the graph is included on a layout in a different file.
Summarize your experiments on one page
Prism makes it very easy to create page layouts containing multiple graphs, and provides tools to equalize the graph size and to align axes. These graphs can all come from one project, or each can come from a different project. Either way, everything is fully linked and the page layout will be updated when you edit your data or change the analysis choices. You may add drawings, text, and imported pictures to the layout, as well as data and results tables. This lets you turn a page layout into a complete one-page summary of your experiments for presentations, papers, or your lab notebook.
Chain analyses
If you chain analyses (for example, first transform the data, then do nonlinear regression, then do a normality test on the residuals), you can view them in a nested view (data plus results) to clearly document the order of the analyses.
Automatic error bars
Simply enter your replicate values and view the linked graph. Prism automatically creates a graph with error bars. The calculations are entirely automatic, and you may display your error bars as the SD, SEM, 95% CI, mean and range, median and range, or median and quartiles.
Simultaneous analysis of related data sets
Experiments typically compare several experimental conditions. With Prism, one command analyzes and graphs all the related data sets in your data table. You don’t need to repeat commands for each experimental condition.
Instant analysis of data from repeat experiments
You rarely perform an experiment just once; you repeat it to verify the results. Prism lets you analyze and graph data from a repeat experiment instantly. Click once to duplicate the data table, along with linked analyses and graphs. Then enter the new data, and instantly view linked results and graphs. You don’t have to retype commands and don’t need to create complicated batch files or macros. Save even more time by saving your work as a template. Every time you repeat an experiment, simply open the template, enter the data and info constants, and you are done.
Size:18.61Mb
- 上一頁:《概念化建築性能分析》(Autodesk Ecotect Analysis 2010 x86)[壓縮包]
- 下一頁:《集郵輔助軟件》(LIBERTY STREET STAMPMANAGE DELUXE v2009 1.5)[光盤鏡像]


- [行業軟件]《小型商業企業管理軟件》(DaySmart )V8.0.3.564[壓縮包],行業軟件、資源下載
- [編程開發]《易語言 V4.04》簡體中文綠色特別版,編程開發、資源下載
- [安全相關軟件]《PDF_Password_Remover3.0》簡體中文綠色版[壓縮包]
- [安全相關軟件]《網絡事件管理》(GFI EventsManager)v11.2.0.20110810[壓縮包]
- [應用軟件]《MSC 熱流分析軟件》(MSC SINDA v2008 R1)[ISO]
- [行業軟件]《疲勞壽命分析軟件》(LMS.FALANCS.V2.13)[Bin]
- [操作系統]《Debian Linux 4.0》V4.0[ISO]
- [軟件綜合]Flash反編譯工具(JPEXS Free Flash Decompiler)v6.2.0中文版
- [軟件綜合]一款免費的電影下載工具KK電影下載器,用10秒鐘內找到你想要的電影
- [行業軟件]《sketchup模型庫-zfconnor-SU組件庫》(sketchup model)2010[壓縮包]
- [硬盤游戲]《探索大西洋》(Atlantic Quest)硬盤版[壓縮包]
- [軟件綜合]SUSE Linux Professional 10.0 多語言版|SUSE Linux Professional 10.0
- [其他圖書]《水電設備安裝工程概算定額》2003版
- [應用軟件]《三維圖形計算器》(Runiter Graphing Calculator 3D Pro) v3.2 [安裝包]
- [教育科技]《中醫學解難-針灸分冊》(天津中醫學院)掃描版[PDF]
- [文學圖書]《憶往昔:一個彝族土司的自述》(嶺光電)掃描版
- [生活百科]建銀汽車商城app v1.0 安卓版 免費下載
- [其他圖書]《二次創業 企業運營脈絡》掃描版[PDF]
- [學習課件]《林巧稚婦科腫瘤學第四版》 第四版[PDF]資料下載
- [人文社科]《心理神探-美國聯邦調查局系列犯罪破案揭秘》(Mindhunter:Inside the FBI`s Elite Serial Crime Unit)掃描版[PDF]
- 《奧多比創作出版軟件》(Adobe FrameMaker v8.0)[ISO],應用軟件、資源下載
- 《CrystalGraphics插件》(CrystalGraphics PowerPlugs 3D Titles and Transitions I to VI 2006)[Bin]
- 《清華大學計算機系網絡課堂之一:寬帶網絡交換技術》[ISO]
- 《模擬星空 v0.10.2版》(Stellarium v0.10.2)開源軟件[安裝包]
- 《金山詞霸2006 SP1》龍卷風最新制作的版本[ISO],應用軟件、資源下載
- 《圖像銳化、陰影色彩細節處理濾鏡》(Topaz Detail)v2.0.5/含注冊機[壓縮包]
- 《智能郵件管理工具》(Chaos Software Chaos Intellect)更新v3.0.4.6/帶破解文件[壓縮包]
- 《玩轉手機》(MobTime Cell Phone Manager)最新版本,應用軟件、資源下載
- 萬能拼音輸入法2.2 版
- 《ATOK 2009 Windows版》(ATOK 2009 for Windows)2009[壓縮包]
- 《實時光線追蹤渲染程序》(Luxion KeyShot Pro)更新專業版V3.0.99/x86+x64[壓縮包]
- 《Spartan 化學》(Spartan)2006.v1.0.2[Bin]
免責聲明:本網站內容收集於互聯網,本站不承擔任何由於內容的合法性及健康性所引起的爭議和法律責任。如果侵犯了你的權益,請通知我們,我們會及時刪除相關內容,謝謝合作! 聯系信箱:[email protected]
Copyright © 電驢下載基地 All Rights Reserved